If you wish to access the data from your MS-DIAL analysis programmatically for post-processing, then you face the non-trivial challenge of parsing the output to a dataframe. This is made challenging because the format of the alignment exports is not a simple xy matrix, but contains two data frames nested within each other, one for the qualitative information and the other for the quant. Consequently the headers for the qualitative data frame begin on row 5, as can be seen in this screenshot.

The qualitative data consists of 32 columns, beginning with Alignment ID, Average Rt(min), Average Mz, and Metabolite name and finishing with MS/MS spectrum. That last column is the point where things get interesting because the four rows above it in that 32nd column contain the headers for a separate table, aligned horizontally instead of vertically.

I have shaded and outlined the different columns for clarity. The blue table has headers in the left hand column (AF). The data includes class, file type, injection order and batch. This is essential data for creating quantitative plots, doing manual post-processing, such as blank subtraction or normalisation, and for many other downstream operations. You could enter this data into your processing as a separate input, but it is desirable to be able to scrape this data from a single input.
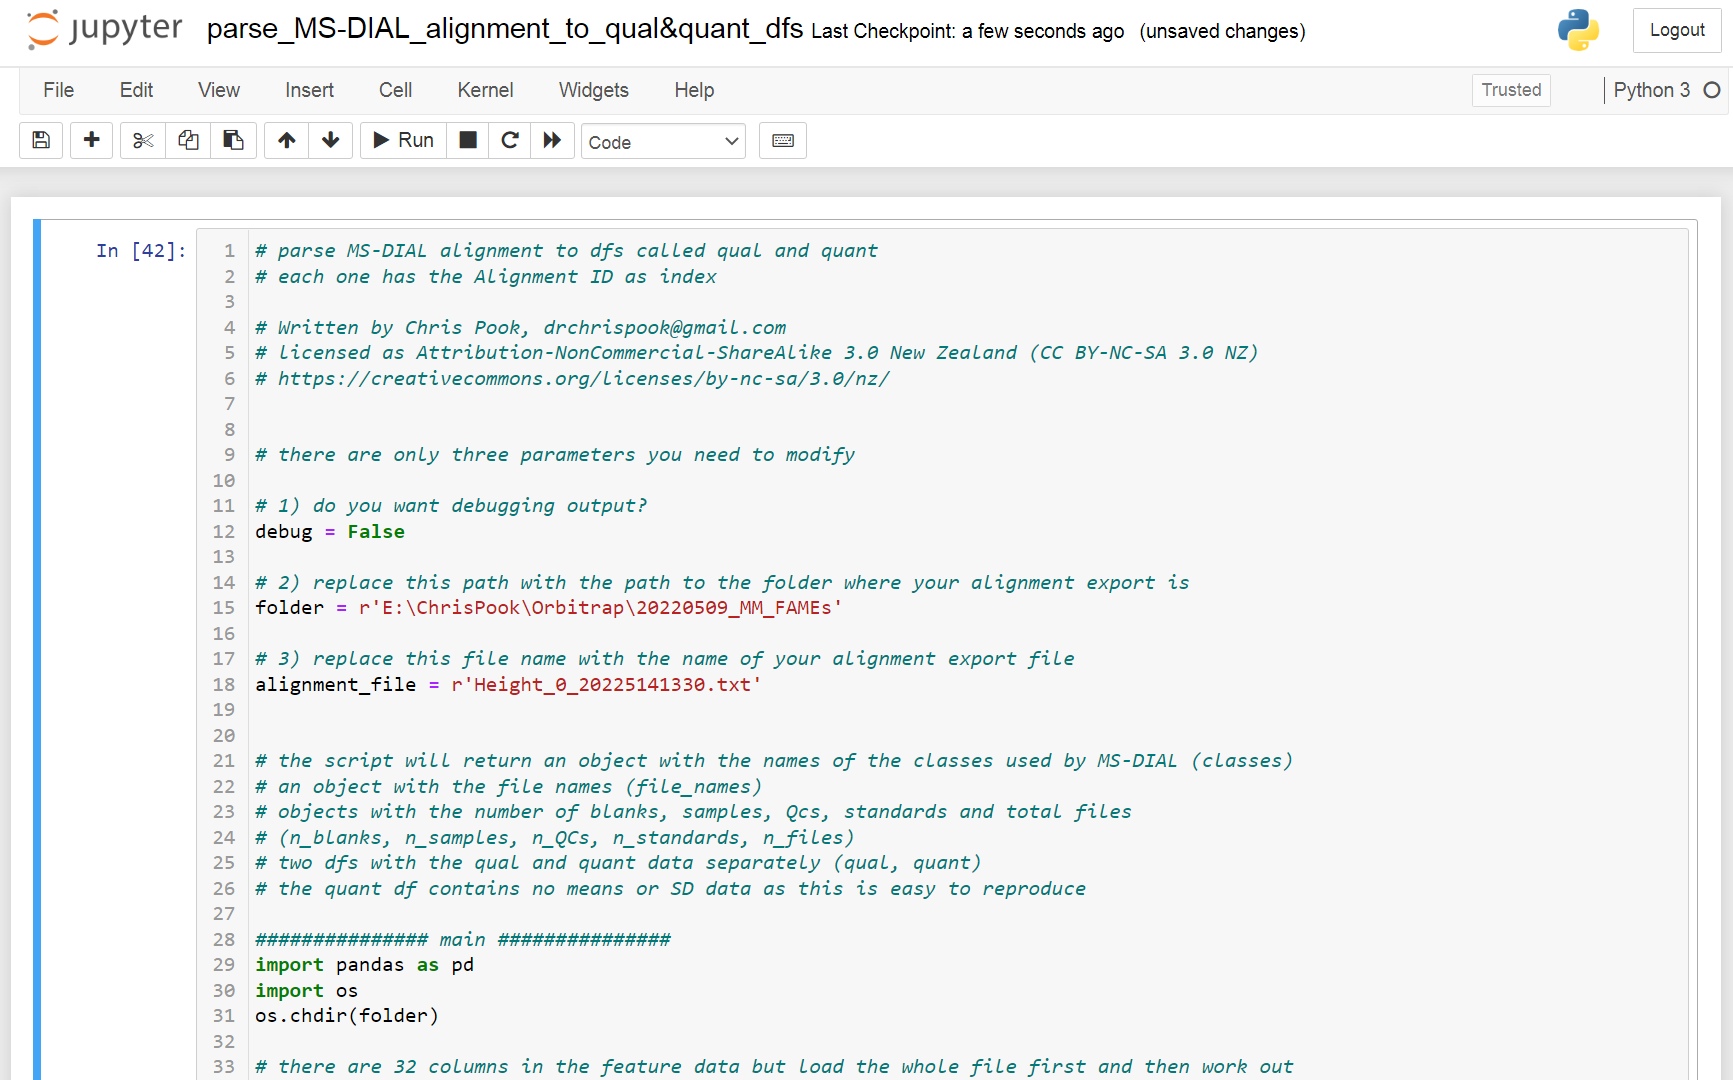
I have written a short python script in Jupyter Notebook to separate the qualitative data and the quantitative data from this single file and to scrape this important metadata and provide access to it as list objects. Please try it out and let me know if it useful.