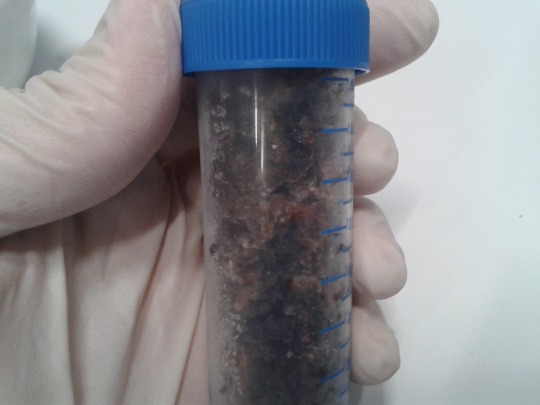
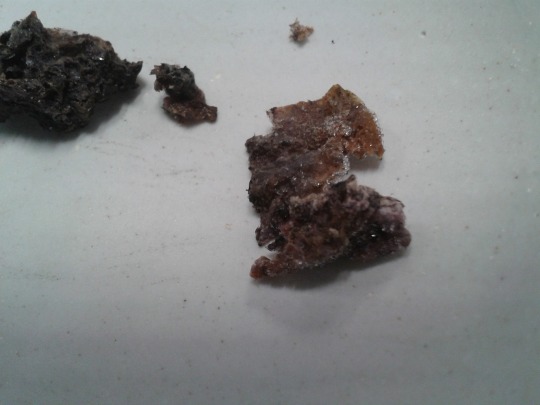
I’m developing a method for quantifying photosynthetic pigments with liquid chromatography. I started out just mashing up a couple of leaves from some plants in the teaching lab. A begonia leaf and a tobacco leaf. Here’s the begonia leaf before grinding:

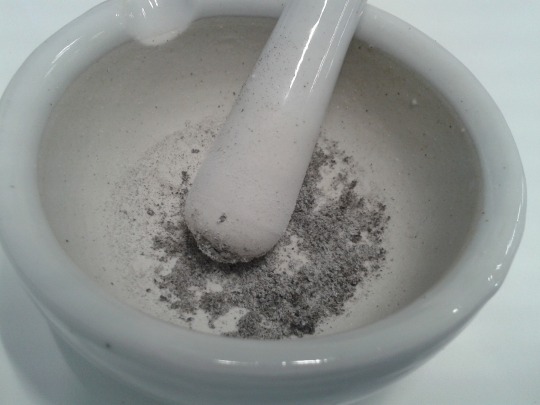
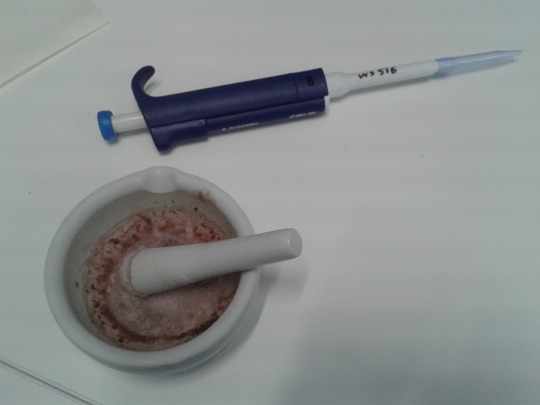
And after grinding in acetone:

I centrifuged the liquid to remove particulates and diluted some of the supernatant in a little more acetone as that bright green colour was probably too concentrated to inject directly.
I initially tried using the diode array detector and the mass spectrometer in tandem so that I could confirm identities of DAD peaks with the mass spectrum but I think the sensitivity of the mass spec was too low. The pigments absorb light pretty strongly, as you might expect, so you don’t need to inject high concentrations to get a signal from an absorbance detector. So I gave up using the mass spec and just looked for peaks in the DAD. Initially I just infused them straight through the DAD without using an LC column so that I could confirm that I could see peaks at the right wavelengths. Plant pigments fall into several different categories. I was expecting to see chlorophylls, which are common to all plants, as well as some xanthophylls and/or carotenoids. We happened to have some carotene in our chemical store so I prepared a standard dissolved in acetone to inject as a reference.
The direct injections worked well with large peaks visible at 440nm (xanthophylls/carotenoids) and 640nm wavelengths (chlorophyll). The carotene showed up very nicely at 440nm, as expected, with nothing visible at 640nm. Next I wanted to see how many different pigments I could separate but I wanted to do it really quickly, without setting up a full LC gradient. So I ended up trying just a Phenomenex C8 guard column in a holder instead of an actual analytical LC column and set a 1 minute gradient from 20 to 100% isopropanol. I had to use isopropanol, instead of the more usual acetonitrile or methanol, because these pigments are quite hydrophobic. This seemed to work well so I stretched the gradient out to 6 minutes and ran them again (yes, I ended up running a full gradient after all but it was worth building up to it). As you can see from my quick-and-dirty method it actually worked beautifully:
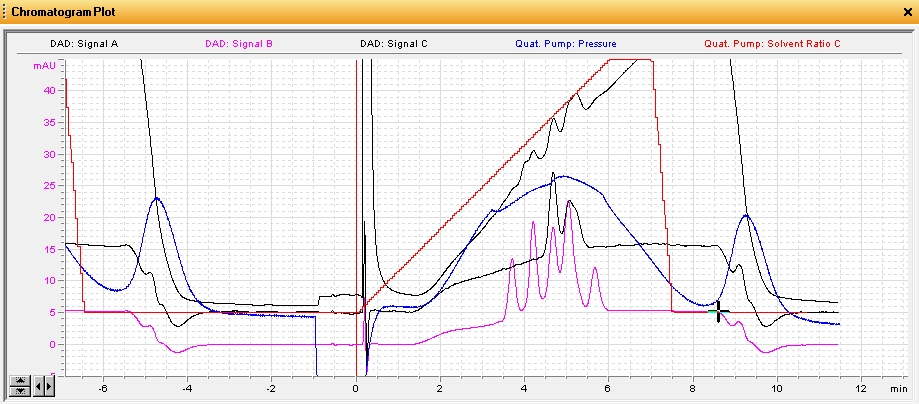
This rather busy chromatogram shows several different plots. The two relevant ones are the pink one (440nm) and the black one just above it (640nm). The peaks in these plots represent different pigments in their respective classes. There’s five xanthophylls or carotenoids and at least three chlorophyll peaks (the last one is two peaks coeluting). The last of the pink peaks happens to coelute perfectly with my carotene standard and they shared the same absorbance spectra. Each pigment tends to have a unique absorbance spectra corresponding to its role in absorbing different wavelengths of light. The plot below shows the five xanthophyll/carotenoid peaks and their respective absorbance spectra.

All in all a pretty successful day’s HPLC! I’m looking forward to applying this to some marine benthic sediments tomorrow to see what sort of pigments are present in the microphytobenthos. I’m also now well set up to investigate the pigments in the giant springtails I mentioned recently.
A useful paper for background and huge amounts of detail about pigment HPLC is Bidigaire et al, (2005):
Bidigare, R. R., L. Van Heukelem and C. C. Trees. 2005. Analysis of algal pigments by high-performance liquid chromatography. In: Algal Culturing Techniques (R. A. Andersen, Ed.), Academic Press, New York, pp. 327-345.