Research Update

Having meant to write several posts about exciting things that have gone on in the past couple of weeks I am now faced with combining them all, for efficiency’s sake, into another “research update”.

This week I have received an enquiry about analysing pigments and toxins found in the colourful tips of New Zealand giant springtailsHolacanthella. This could be a really cool little piece of analysis if it works. I’m going to have to head out into the Waitakeres to poke some lumps of rotting wood in the hope of finding some of these punk woodlice to play with.

After a visit from Don MacLeod of the NZ Beekeeper’s Association last week I am testing out some more extractions of neonicotinoid pesticides. A new paper was published this week in Environmental Chemistry documenting the occurrence of these pesticides in pollen and honey from hives across the US. The paper was written by Alex Chensheng Lu et al (2015), who kindly shared a copy with me. The paper reports that, during the Summer months, several neonicotinoids were present in pollen at concentrations of several ng/g; concentrations that may be acutely toxic to bees (Laycock et al 2012). The authors discovered measurable concentrations of at least one neonicotinoid pesticide in >70% of honey and pollen samples. I am hoping I can repeat their analysis in New Zealand samples to see if we have a similar issue here.

I have also been developing a method for the quantification of bile acids by LC-MS, which is causing me headaches as certain compounds won’t stay in solution (lithocholic acid, I’m looking at you), some seem to have a very low response in the instrument and others are playing hide-and-seek! The solution, as ever, is a bigger chicken.

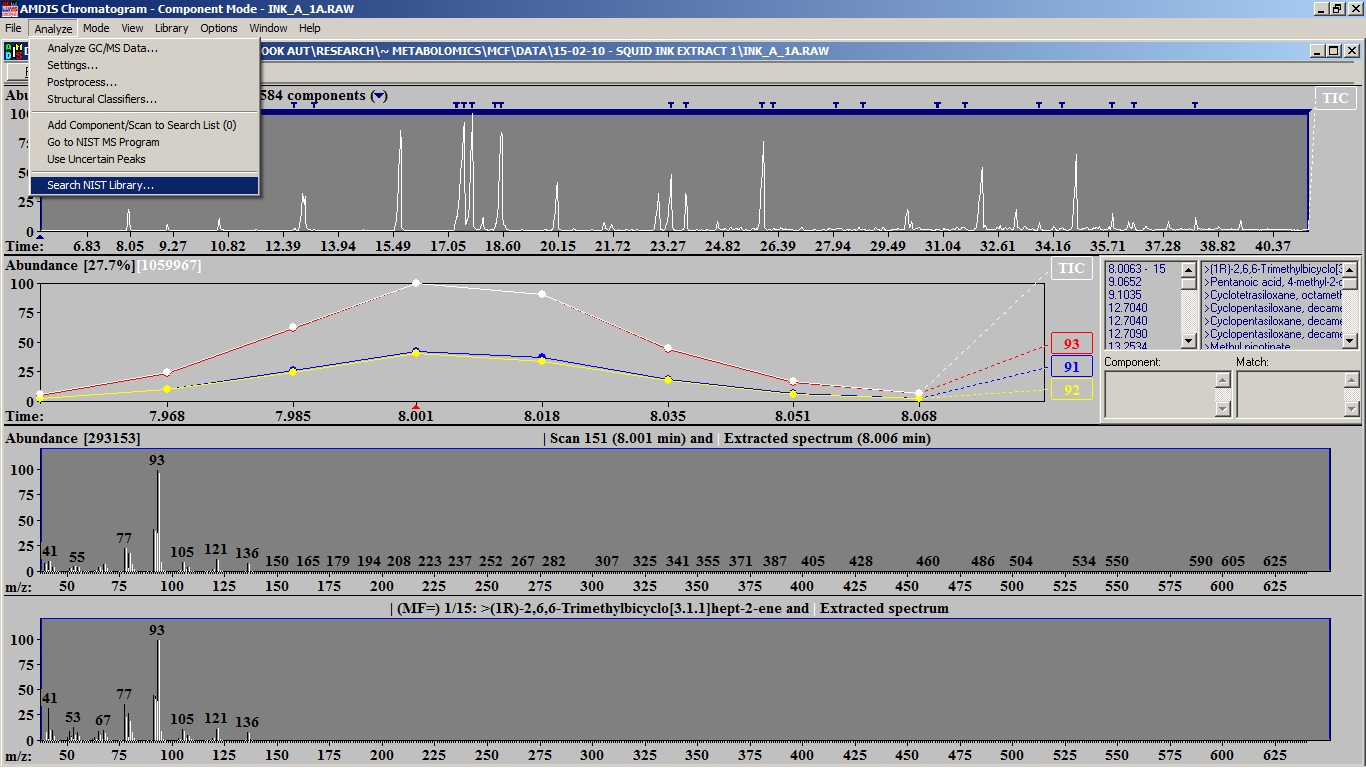
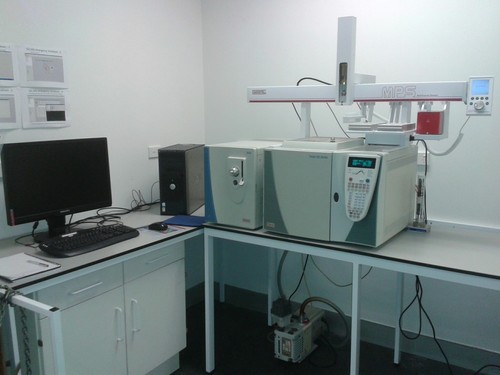
I have also been plotting further awesome research plans for the future, submitting an application for a Summer studentship to get someone to look at polysaccharide structures, again with LC-MS. My life seems to revolve around the instrument sometimes but this week has not been all about the liquid phase. I have also been emailing around the results of some test analyses I conducted using methyl chloroformate derivatisation and GC-MS to try and expand the use of this very nice little method within the school. Consequently I found myself preparing samples of mangrove leaf extract, lamb and wagyu beef, fermented mussel liquor and hydrolysed beef protein. I was meant to have a go at some polyamines for another of the PhD students but I forgot their sample. Doh.

Apart from this mass-spectrometry-based fun I may have a student looking to measure total triacylglycerol content and fatty acid profiles of fish oocytes at some point. I’ve also had a really awesome kick-off meeting for my new PhD student, who is going to be studying plant phenology. We are kicking about ideas for the acquisition and installation of a phenocam.

Its been a crazy busy week!

Refs

Chensheng (Alex) Lu, Chi-Hsuan Chang, Lin Tao and Mei Chen (2015). Distributions of neonicotinoid insecticides in the Commonwealth of Massachusetts: a temporal and spatial variation analysis for pollen and honey samples. Environmental Chemistryhttp://dx.doi.org/10.1071/EN15064

Laycock I, Lenthall KM, Barratt AT, Cresswell JE (2012). Effects of imidacloprid, a neonicotinoid pesticide, on reproduction in worker bumble bees (Bombus terrestris). Ecotoxicology 21(7):1937-45. http://link.springer.com/article/10.1007%2Fs10646-012-0927-y

Advertisement

AMDIS is AMDAWESOME

As a follow-up to this earlier post I think its important to note that I have discovered how to search the entire NIST library from AMDIS! It is odd but this doesn’t seem to be well described in the manual so maybe I can help other GC-MS ninjas to get the most out of their data by describing it here.

The first thing you have to do after loading a results file, is to analyse it. You don’t need to use any particular library to do this, you just need AMDIS to identify all the component scans in the sample. Any identities assigned to targets in this step will be overwritten in the following one.

Next you have to select the “Search NIST Library…” option from the “Analyze” [sic] menu.

AMDIS11

This will give you a bunch of familiar options. If you haven’t set any reasonably stringent conditions in your earlier analysis step then you might want to specify a threshold to the intensity of the spectra it searches in the highlighted box in the image below. This will save you quite a lot of time. Just make sure you’ve got the mainlib selected in the drop-down box at the bottom left.

AMDIS22

I’ve tried this before and it just gave me an error message so I assumed it was a bug. Analytical software tends to be ridden with bugs and bits of it often just don’t work. As long as you try it on a file that’s already been analysed it will work though.

The output is exactly the same as that from any other AMDIS analysis. The only difference that I can see is that there is no way to automate this process,for batches of results files, unlike when using a custom library. At this stage I am prepared to accept this trade off for the extra hits you get from being able to exploit the ENTIRE NIST LIBRARY.

AMDIS33

You can see here that I’ve had identities returned for 57 targets, using the filters mentioned above. This particular sample is giant squid ink that has been derivatised with MCF*. When I analyse it using the custom library for MCF derivatives I get 114 targets identified. This is pretty good for MCF derv, but when I use the full NIST library to search for matches for all 2592 components I get 192 target matches!

I haven’t done any robust investigations of the accuracy of the full NIST results but they seem superficially relevant. I’m confident the results will at least compliment the MCF-specific results. Watch this space for more detail.

*How awesome is that?

AMDIS and metabolite profiling by GC-MS

AMDIS, the Automated Mass spectral Deconvolution and Identification System, is a piece of freeware produced by NIST in the USA. In combination with an appropriate library of reference spectra the software identifies features in your GC-MS data and compares them to library spectra in order to assigns identities to them. This is fantastically useful for metabolite profiling, or metabolomics, as the data typically contain hundreds of features, each feature being a unique molecular structure present within your samples. It is possible to achieve similar results using other GC-MS software and associated libraries but none of them seem to be able to automate the process in the way that AMDIS does. That’s because AMDIS also has a batch process function in which you can select a whole set of data files and the software will churn through them, producing a single summary file of data. I have a suspicion that MassHunter might have a similar capability but I have never used it so I cannot comment further. We have a Thermo Finnigan GC-MS so I am using their Xcalibur software to acquire the data. The Xcalibur browser software allows me to view the collected data and search an associated library to identify peaks but the selection of peaks and the identification process is all manual. It has no facility for automatically identifying more subtle chromatographic features such as small peaks coeluting beneath larger ones. Therefore not only would it take me a lot longer to get the same information by processing these data files manually, I would inevitably fail to spot features. As the concentration of a metabolite- and concsequently the size of the peak it produces in the chromatogram are not necessarily related to their biological function this means I could be missing all the important data. 

So AMDIS is a wonderful tool. It is, sadly, flawed too. The Xcalibur software uses a NIST library of reference spectra containing over 200,000 spectra. This massive amount of data makes it very good for identifying peaks. Oddly, AMDIS, which is written and maintained by the same people who curate the reference library, cannot use that library. Fortunately NIST publish a file converter program which allows you to convert your NIST libraries into a format AMDIS can access. However, AMDIS still cannot cope with a library larger then about 25,000 spectra and throws an error if you try to analyse data with a larger one. This is only about 12.5% of the full NIST library so, unless you’re prepared to analyse all of your samples eight times, it makes it unusable!

The solution seems to be for researchers conducting metabolite profiling to build their own reference libraries for AMDIS to use based on the derivatisation and analysis of pure standard compounds. Derivatisation is the process of chemically modifying metabolites which would otherwise be non-volatile to make them volatile and, therefore, amenable to gas chromatographic separation. The two most common ways of derivatising metabolites are to add a methyl or trimethylsiloxy groups by an ester linkage by treatment with one of a diverse range of derivatising reagents. The reagent I currently use is methyl chloroformate, which, in the presence of methanol and pyridine, converts amine groups  into carbamates and carboxyl groups into methyl esters. It does not react with alcohols so it does not allow me to analyse sugars, for example, which require trimethylsilation. 

The practical upshot of this is that some of the molecules which are produced by methyl chloroformate derivatisation are not encountered in nature or in industry. As a result there might not be reference spectra for that molecule in the NIST library, making their identification impossible without some expert-level interpretation of their spectra. Even this will not give a definitive answer but may suggest an identity which will have to then be confirmed by derivatisation and analysis of a pure standard. 

Fortunately the potential of GC-MS metabolite profiling is such that several research groups have invested the time and effort over the last ten years or so to build their own reference libraries for use with AMDIS. Two notable examples are the Golm Metabolome Database mass spectrum library [GMD] and Silas Villas-Boas’ group at Auckland University. Silas published a library in the supporting information of a paper describing the application of methyl chloroformate derivatisation for metabolite profiling. I have been using their libraries, as well as bits of the NIST library to try and assign identities to peaks in my own samples using AMDIS. The version of the GMD library I downloaded contains 2,594 spectra whereas the SVB library contains 223.SVB library gave me 125 hits from an MCF-derivatised sample of human urine and the GMD library gave me only 5. There are several reasons for this discrepancy: firstly the GMD library was composed for plant metabolite profiling and not cells, as was the SVB library. Secondly, the GMB library contains TMS derivatives as well as MCF derivatives and so not all of those 2,594 are applicable to my samples. Thirdly, I don’t know what instrument the data for the GMD library was collected on but I know that Silas’ group over the road at the University of Auckland use a Thermo Finnigan GC-MS that is very similar to mine so their reference spectra are going to be very similar. This is not the case with two quite different GC-MSs, which can produce quite different spectra. 

I’ve tried analysing the same data using 25,000 spectra

chunks of the NIST library and I’ve found some very dubious results which I’m pretty sure aren’t in my urine. Such as methamphetamine-d5! This is an excellent example of the problem with this type of analysis: if you search a large enough number of reference spectra you will always end up with “false positives”. This is pointed out in a paper I read today which presents an alternative to AMDIS for processing GC-MS metabolite profiling data and that was also produced by Silas Villas-Boas’ group at the UoA: Identifying and quantifying metabolites by scoring peaks of GC-MS data. So tomorrow I will be mostly playing with R and trying to get some example analysis done using the tools presented in this paper. Hopefully no deuterated methamphetamine will be involved! 

GC-MS: Thermo Trace GC Ultra – DSQ

This is our venerable single quadrupole GC-MS (Gas chromatography–mass spectrometry). 

image

This is one of the two mass spectrometers we have, the other being the Agilent triple quadrupole LC-MS. It is a fairly standard instrument with the split/splitless injector and a 30 metre VF5-MS column. The recent acquisition of the Gerstel Multipurpose Sampler has given it an entire new lease of life, allowing us to perform sample preparation and automatic injection by headspace analysis, Solid Phase Micro Extraction (SPME) and conventional liquid injection. The instrument lives in an air-conditioned annex of my lab and is run from the PC next to it via Thermo Xcalibur v1.4 software and Gerstel’s Maestro software for the MPS.

Current applications for this instrument include a research project into the function of terpenoids in plant immune response, the analysis of sugars in a wide variety of samples by acetylation for GC, profiling of volatile compounds in seaweed and metabolite profiling by methyl chloroformate derivatisation, by the method of Smart et al (1). 

(1) Smart, K. F.; Aggio, R. M. B.; VanHoutte, J. R. and Villas-Bôas, S.G. 2010. Analytical platform for metabolome analysis of microbial cells using methyl chloroformate derivatization followed by gas chromatography-mass spectrometry (GC-MS). Nature Protocols 5: 1709 – 1729. doi:10.1038/nprot.2010.108

new Gerstel MPS

In a moment of stunning brilliance on my part I managed to convince the school to purchase an autosampler for our Thermo GC-MS. This wasn’t actually that difficult once I’d pointed out that the $120,000 instrument was effectively unusable for research without one.

After a lot of contemplation we opted for the Gerstel Multi-Purpose Sampler as this seemed to be the most flexible platform and wasn’t manufacturer-specific. This was an important consideration given the 10 year age of the GC-MS so if we upgraded to an Agilent GC-MS in the next few years <cough! cough! Hint, hint> then we’d be able to transfer it to the new instrument without issue. 

The MPS was installed about 6 weeks ago and has already injected more samples into the GC-MS than it saw in most of the previous year! Awesome is the power of automation! I cannot wait to set up some automated sample prep. I am really keen to try methyl chloroformate derivatisation for metabolite profiling of biogenic amines, organic acids and other small metabolites. Silas Villas-Boas of Auckland University School of Biological Sciences and his PhD student Sergey Tumanov very kindly shared their method (1) and library with me and I have been itching to try it out. 

Many thanks to Gerstel for a beautifully constructed and controlled instrument and also to Udo Rupprecht of Lasersan for doing the install and providing support. 

Here’s a picture of the beast. You can almost smell the barely contained analytical potential!

;-D

image

Reference

(1) Smart, K. F.; Aggio, R. M. B.; VanHoutte, J. R. and Villas-Bôas, S.G. 2010. Analytical platform for metabolome analysis of microbial cells using methyl chloroformate derivatization followed by gas chromatography-mass spectrometry (GC-MS). Nature Protocols 5: 1709 – 1729. doi:10.1038/nprot.2010.108