atmospheric carbon dioxide sensing with an Arduino

I was asked by my Lab Manager to investigate whether one of our CO2 incubators was working properly. Apparently there’s some doubt as to whether it was maintaining CO2 levels. CO2 is an easy gas to detect for the same reason that it causes global warming: it absorbs infrared radiation. You can now buy cheap Non-Dispersive InfraRed CO2 detectors for about US$40 from websites such as AliExpress. However, CO2 incubators typically enrich CO2 to about 5% by volume while most of the cheap sensors only measure up to around 0.5%, or 5,000 parts per million [ppm]. I found a sensor from Sandbox Electronics that works up to 10% by volume, or 100,000ppm. Perfect for testing CO2 incubators.

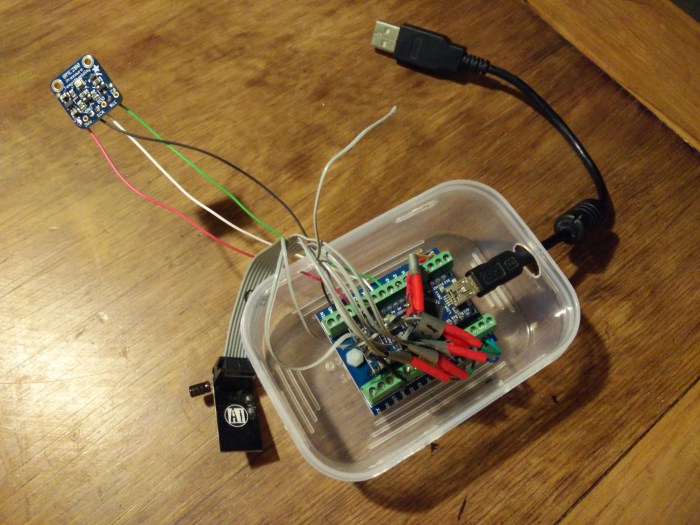
The MH-Z16 NDIR CO2 Sensor costs $67.95 and comes with a UART to I2C adapter. This makes powering it and communicating with it quite simple: just connect four wires to the development board of your choice! I used an Arduino Nano to read the values from the sensor and send them to the laptop over the USB connection that was also powering it. The sensor can be calibrated in atmospheric CO2 conditions at the push of a button. I have reservations about this one-point calibration but “you pays yer money…”, as my dad used to say.

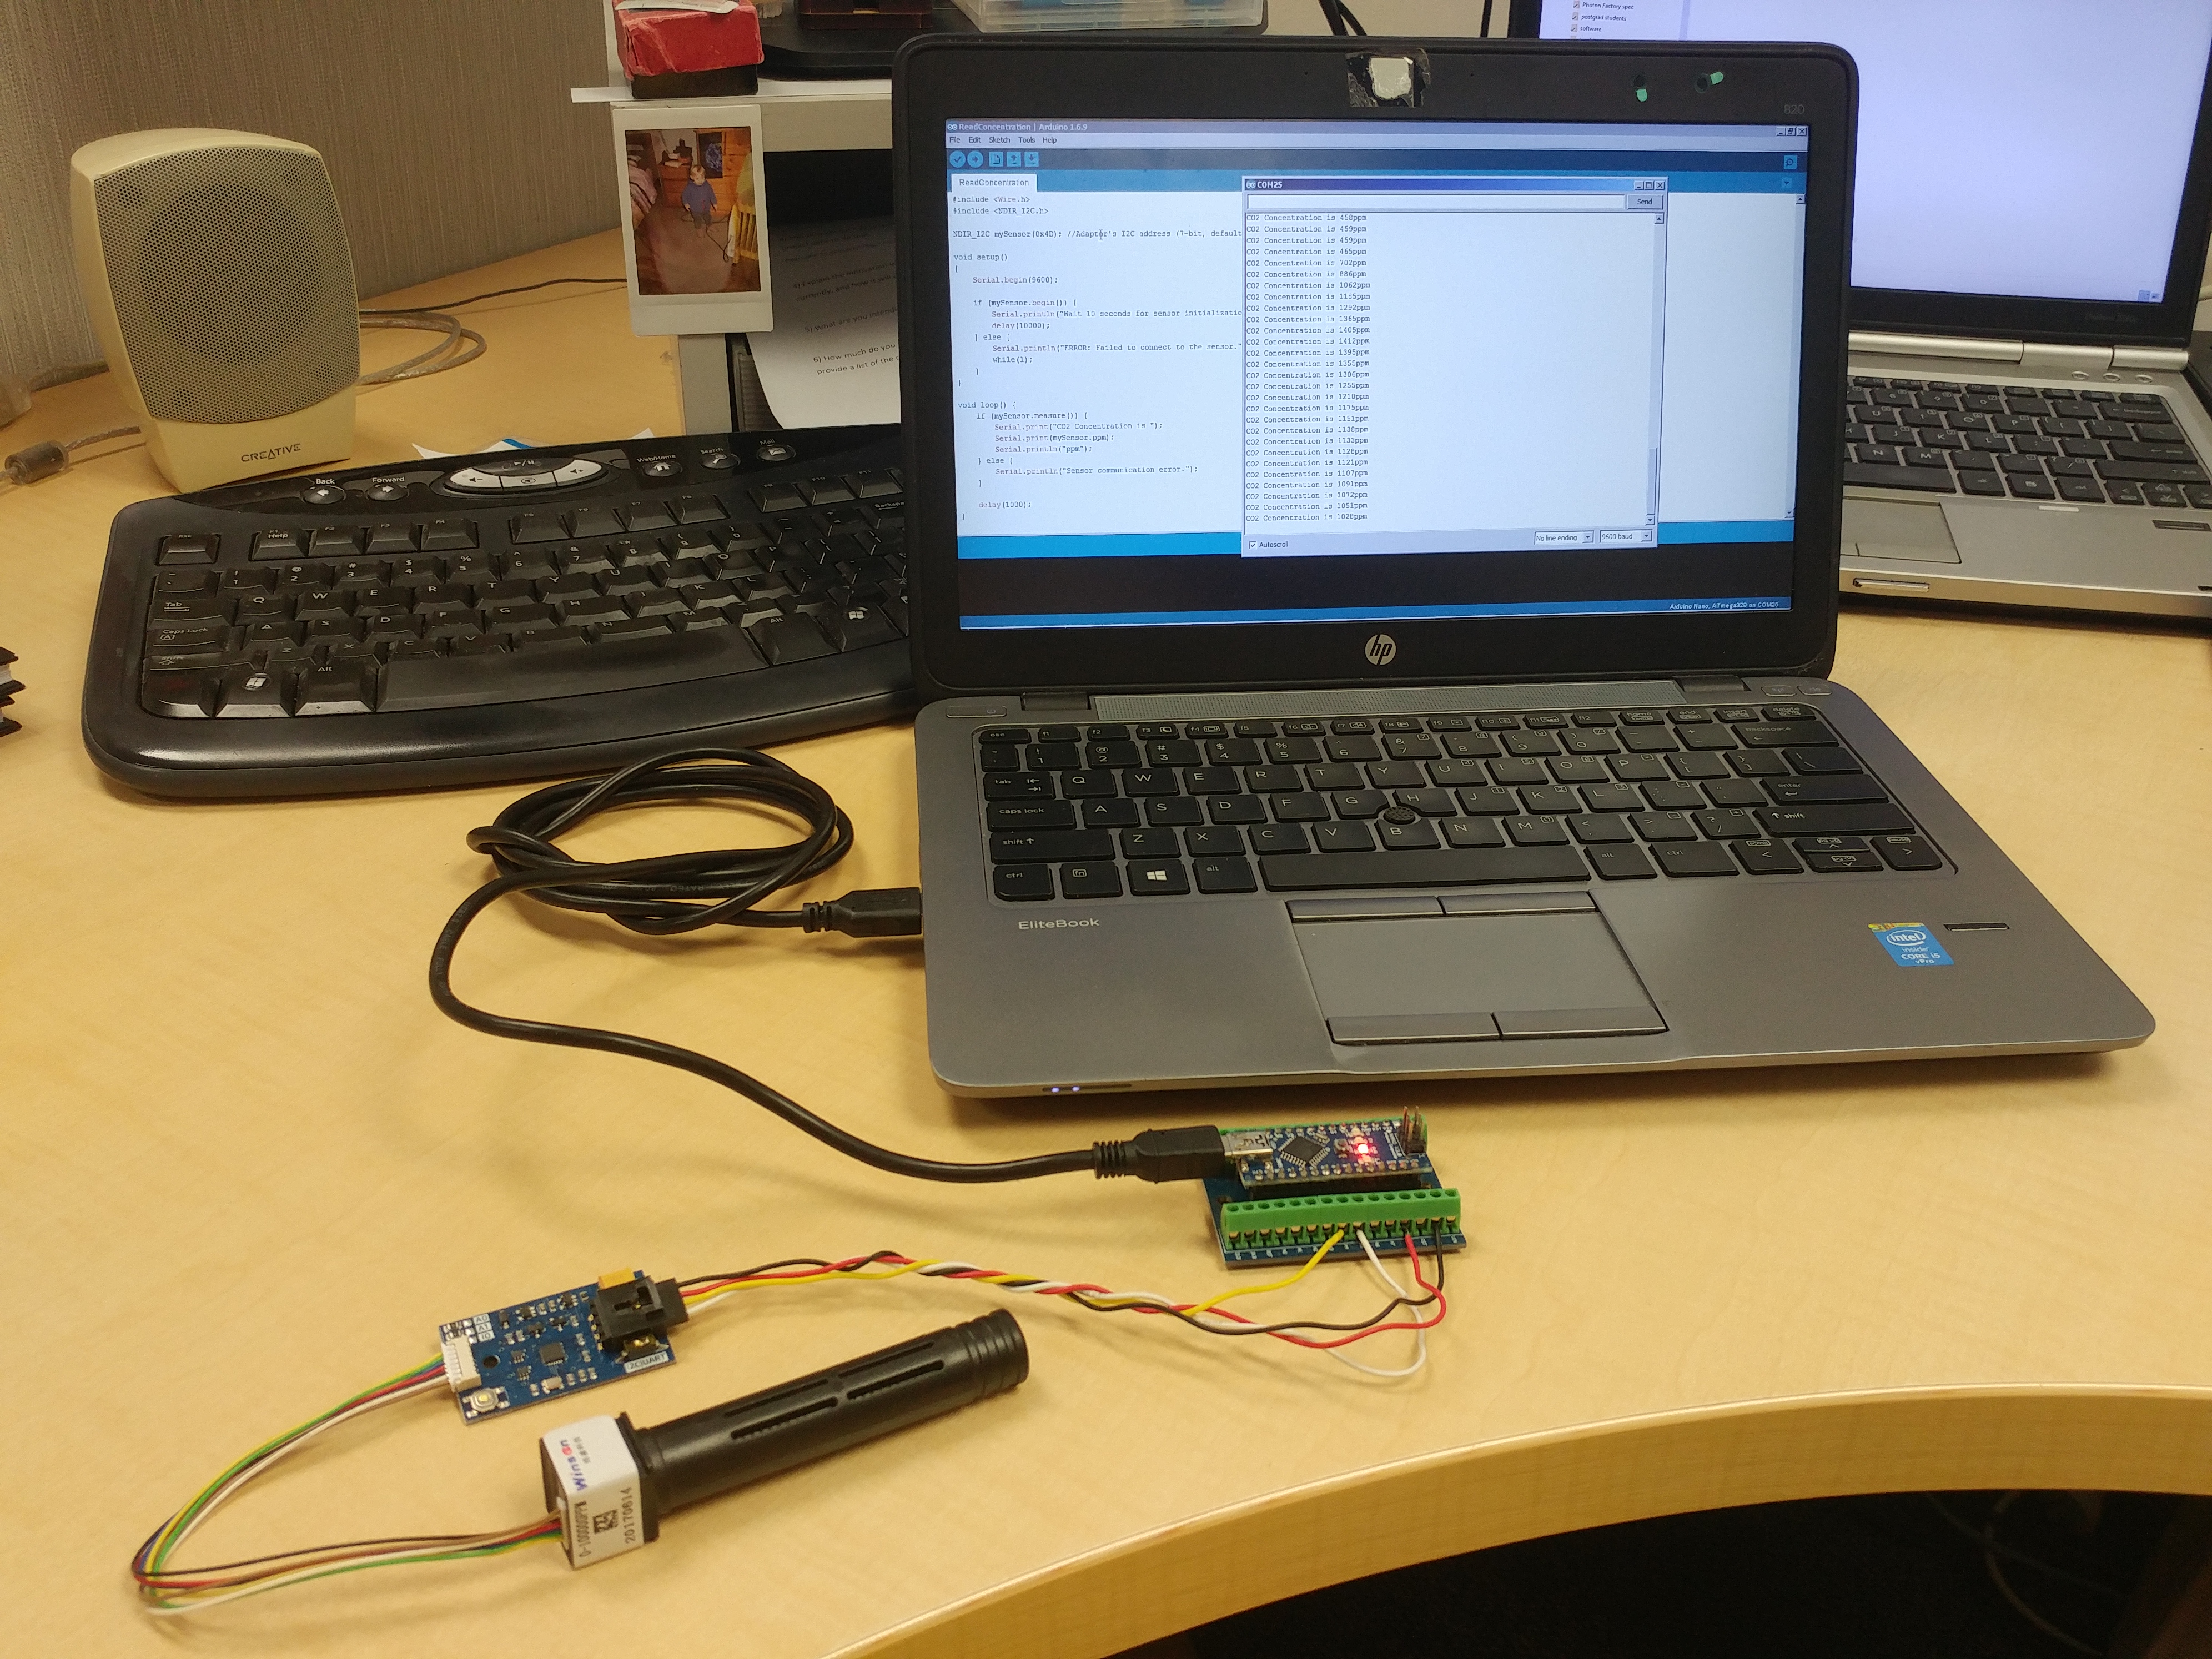
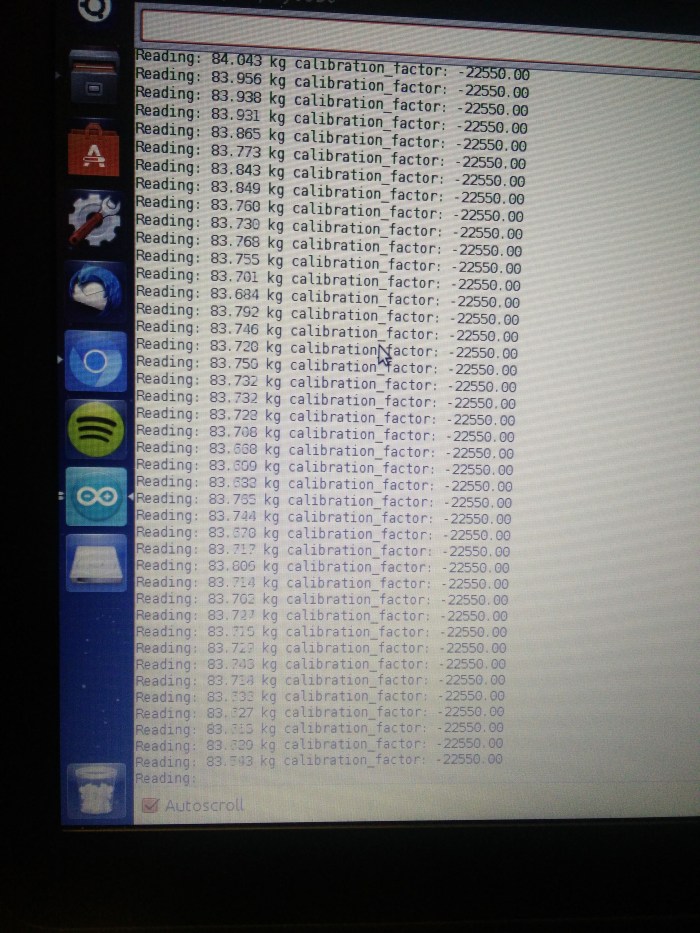
The Nano is sitting on a screw terminal shield with mount holes for easy connections ($4 well spent for making secure, non-permanent connections to the Arduino). On the laptop screen you can see data coming in from the example sketch I copied from the vendor’s website and using the Arduino library they provided. The sketch sends a reading every second. The serial output shows a starting CO2 reading of 458ppm which climbs slowly to >1000ppm when the photo was taken. This is because I was sitting in front of the sensor taking the photos and it’s registering a local CO2 increase as a result of my breath. If I huffed on it it climbed to >10,000ppm, or 1% by volume. The sensor is very slow to adjust to changes. I had to huff on it for a good couple of minutes until it got that high. Wikipedia tells me that exhaled breath is normally 4-5% CO2 so I guess if I’d kept at it for a while it would have got up there. I might have passed out before then though! 😆 When I moved it away from me it took several more minutes to come back down to ambient levels. Not ideal but fine for my application and budget!

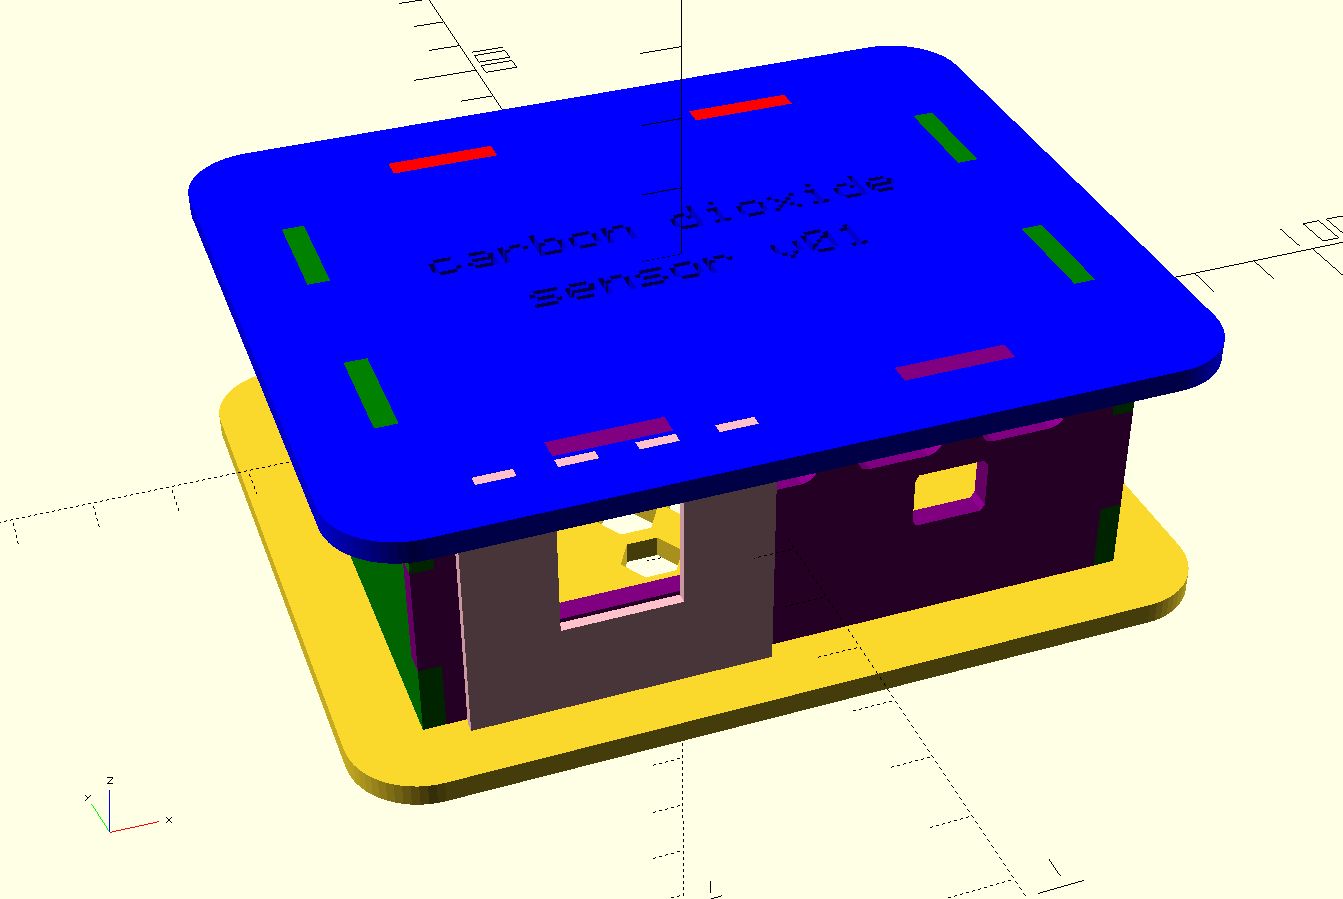
The next task was to make an enclosure to protect the sensor, logic boards and delicate wiring. A couple of evenings spent playing with OpenSCAD yielded an alpha version which I cut on the lasercutter today and tried out. I had to correct a few mistakes in the design but ultimately produced this:

Which became reality as this:

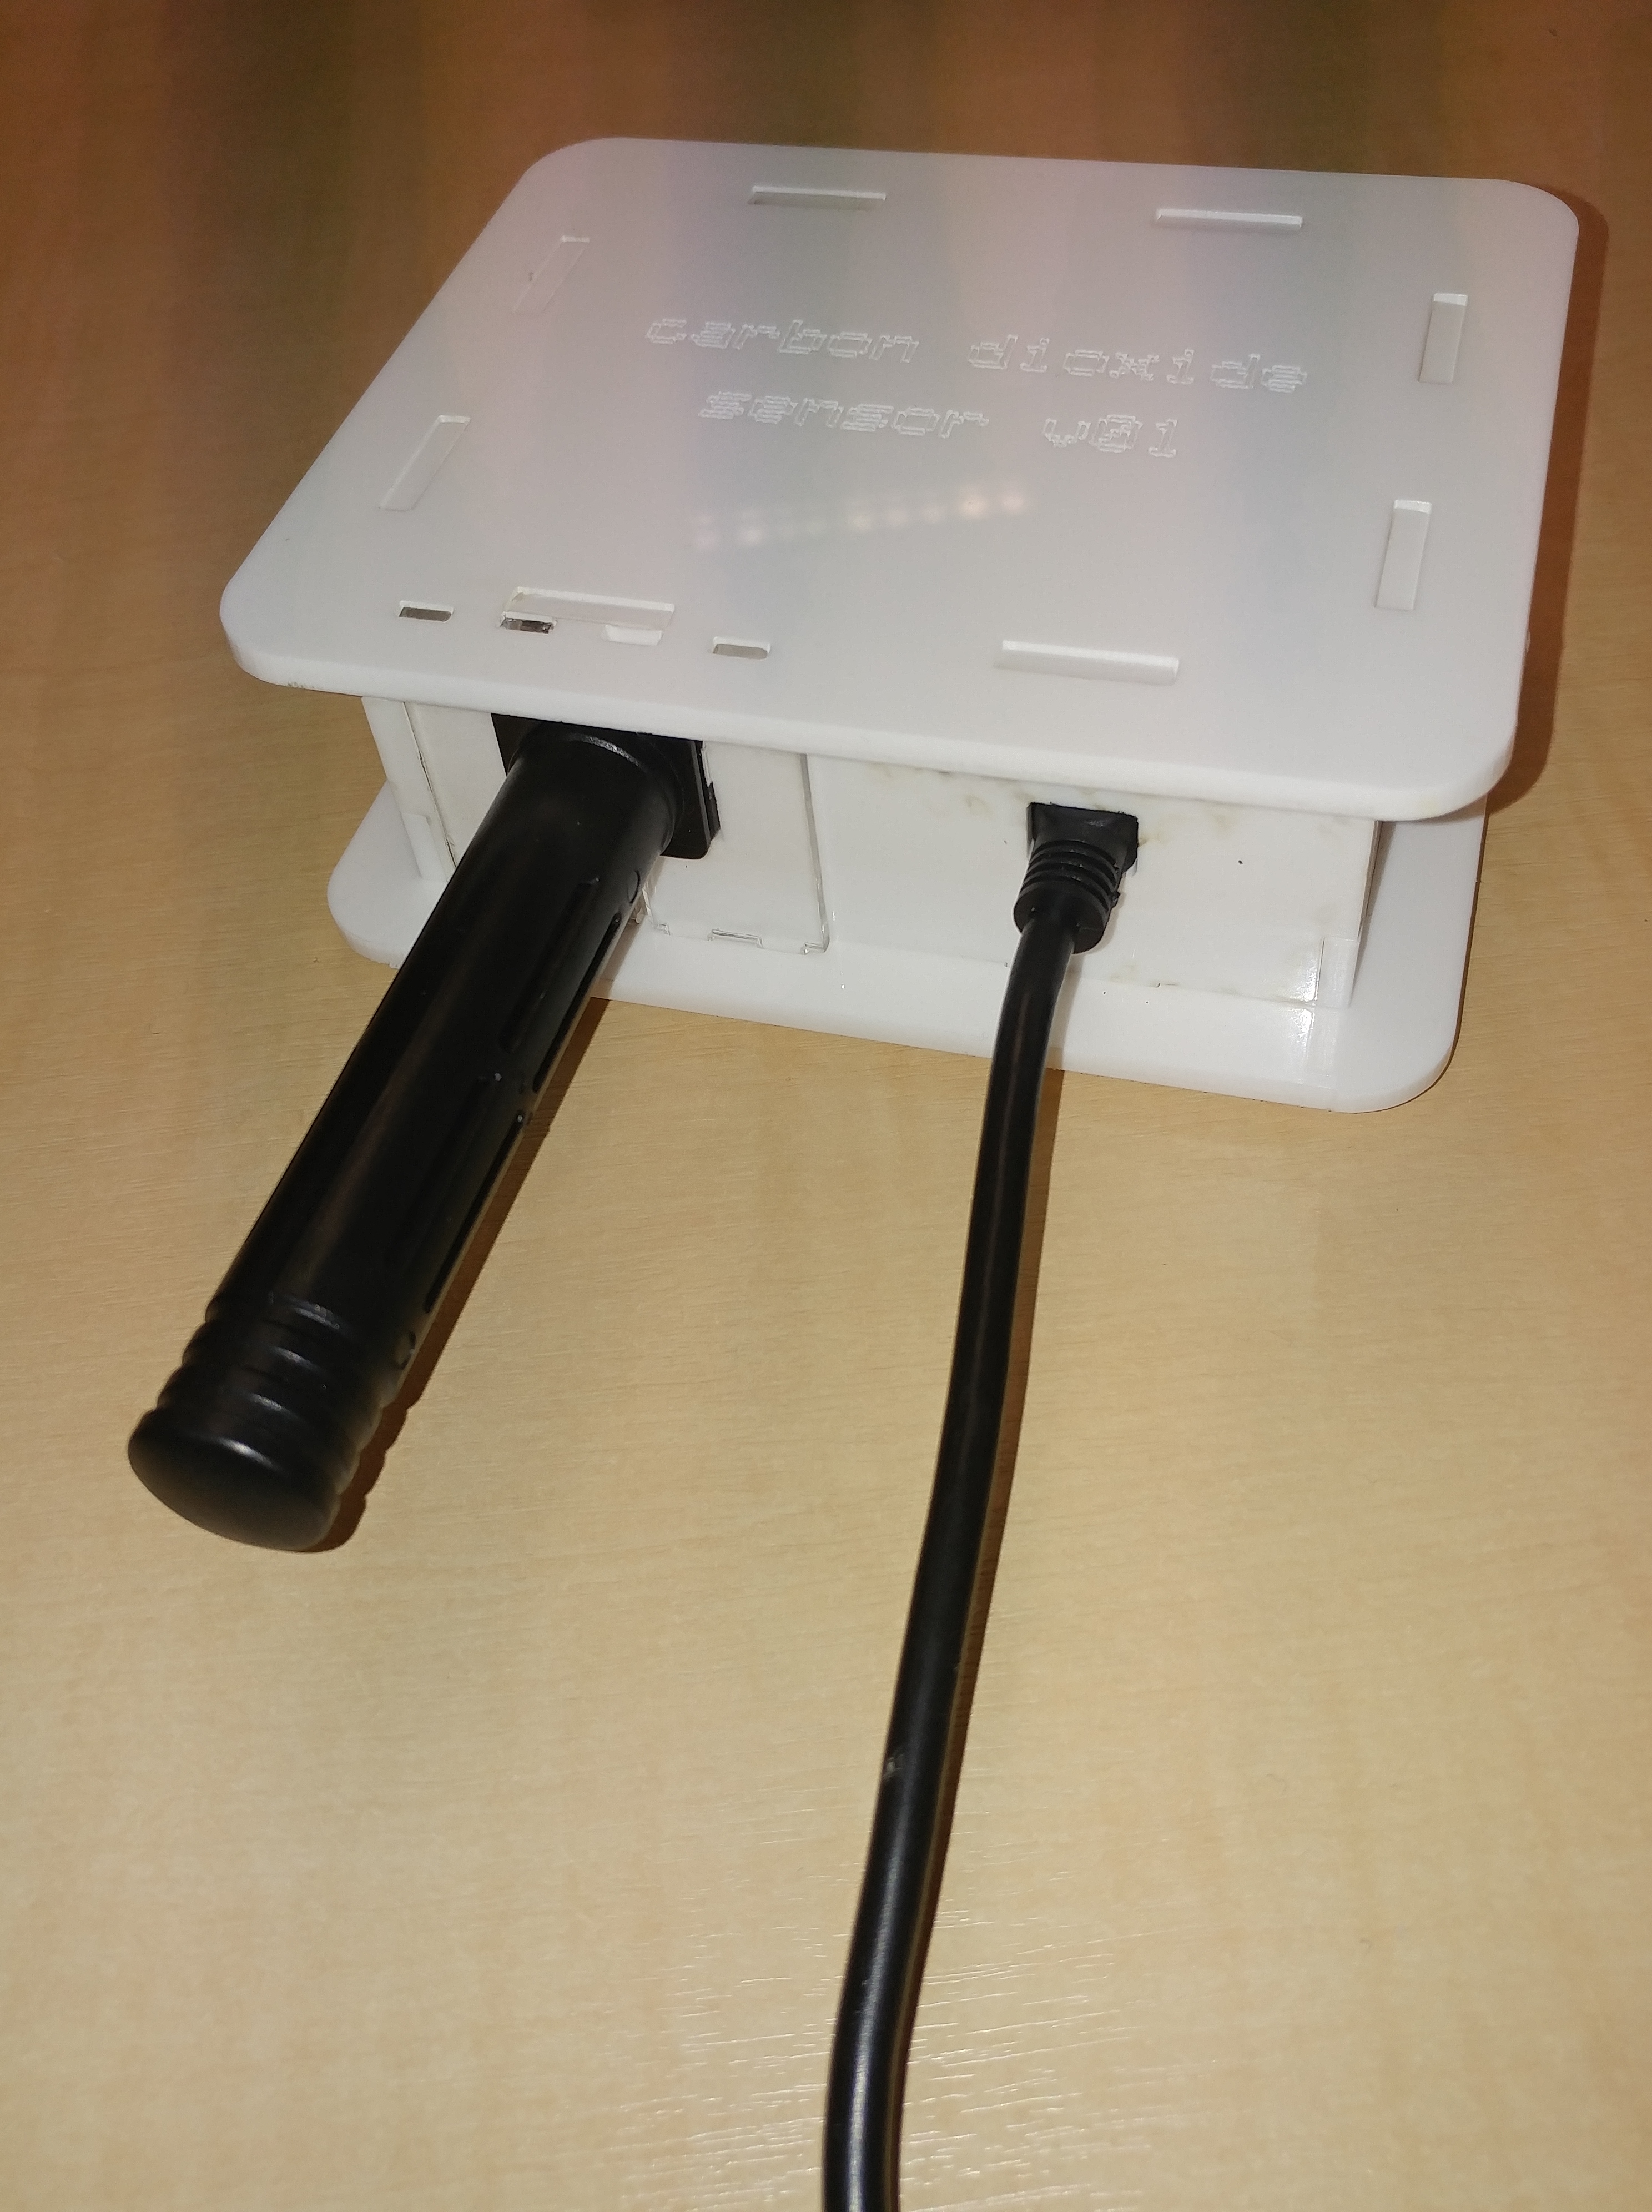
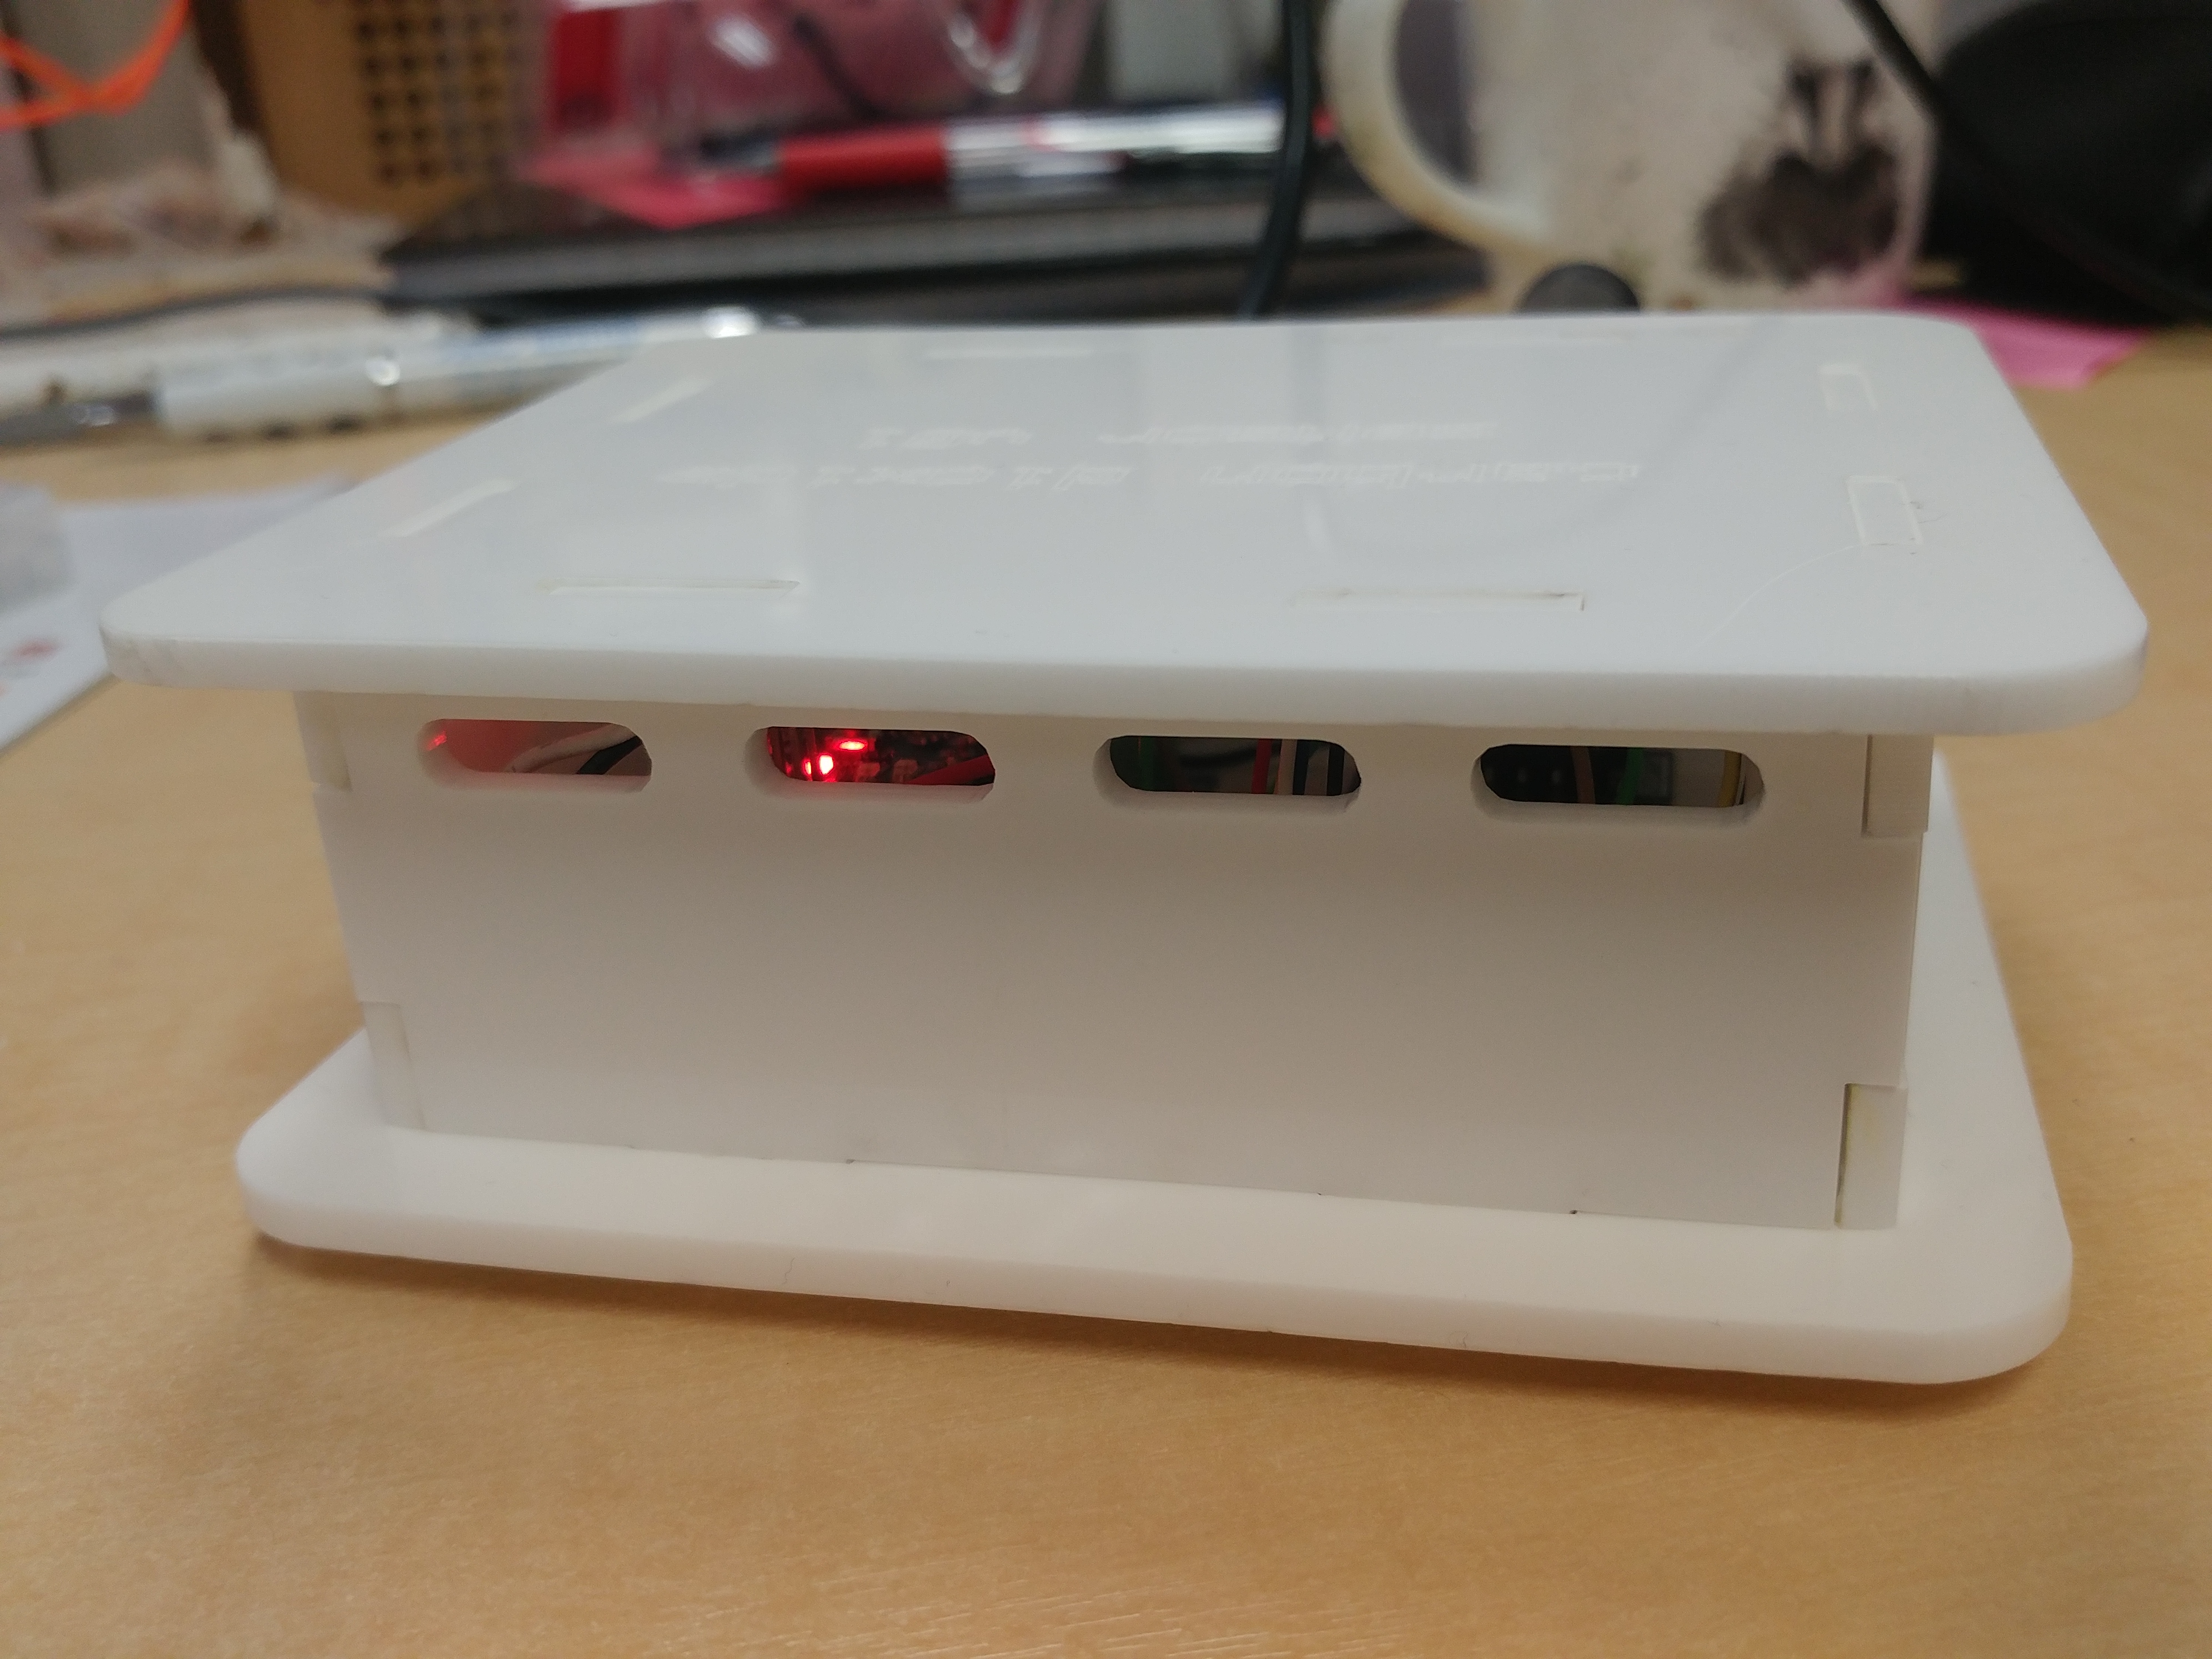
I would have taken a picture of the two boards mounted inside but the lasercut bits fitted together so snugly I didn’t want to try and separate them again in case something broke. You can see the lights of the Arduino inside through the ventilation holes  🙂

I’ve put the sensor in an (allegedly) working CO2 incubator and left it for 20 minutes to stabilise. The sensor read about 40,000ppm, or 4% by volume. As the incubator was meant to be maintaining 5% I’m not too sure what to make of this. I will have to find another incubator to make a replicate measurement. Maybe all of our incubators are a bit off! 😵 However, I’m very pleased with how simple the sensor was to get working and seeing as all you need to run it is a laptop with the Arduino drivers loaded and a serial terminal, such as PuTTY, it is very accessible to even the relatively non-technically minded. 😎

Advertisement

Hacking bathroom scales with an HX711 breakout

Hopefully this will be the start of a series of posts on the Internet of Bees, or the #IOBee. In case you didn’t realise, this is a play on the Internet of Things, or IoT. My intent with the IOBee is to document my application of some basic sensor technology to monitoring the health of bee hives.

There is an excellent writeup here of a conversion of a set of luggage scales to a real-time bee hive mass monitor. I have been wondering if I can do the same thing to monitor the mass of experimental bee hives in some research I’m planning looking at the effects of neonicotinoids upon honey bee colonies. In order to test this out I ventured onto eBay and bought a couple of HX711 breakouts, which you can get for just a couple of dollars.

HX711 breakout

I also bought a cheap set of bathroom scales from the Warehouse, despite the advice on MakeZine, which advised not to skimp. I intended this to be a proof-of-concept so I wasn’t going to be spending big bucks just yet.

bathroom scales

This turned out to be an excellent hacking subject. After taking the back off I found a circuit board carrying the integrated circuit, some components and some wires.

IMG_20160221_155644

The two black pads you can see are the rubber feet on the bottom of the load cells. I prised one out to show you the other side.

IMG_20160221_155936.jpg

The red white and blue wires coming from each of the four load cells needed to be joined together carefully according to the first image in this excellent post on StackExchange that I located after a modest amount of googling. I also found this how-to from SparkFun to be informative.

Once I had soldered the blue and white wires together to mimic the pattern shown and the red ones to the appropriate pads on the HX711 breakout I was left with this:

IMG_20160221_175642

I also soldered the wires from a length of USB cable from an old mouse to the other side of the breakout. The four tabs and their wires were to VCC (red), GND (black), CLK (white) and SDA (green). I drilled a hole in the plastic chassis to pass the cable through and put a cable tie around it on the inside to prevent the wires being pulled off the board. The mount holes in the breakout board ( I love mount holes!) happened to be just the right width to allow me to screw it to the chassis through two of the holes that the original PCB was mounted on. The white thing is a piece of polyethylene milk bottle wall that I cut out and used to insulate the connections of the breakout and to hold it down as the screw heads were nearly as small as the holes. This arrangement allowed the breakout to be seen through the glass window where the LCD used to be. A nice touch. 😀

IMG_20160221_204630.jpg

Having wired everything together I needed an electronic brain for my creation to talk to so I hooked it up to the Arduino Nano I’ve been using as a receiver for my solar-powered, wireless monitoring testbed. Ignore the BME280 and the NRF24 coming off it. VCC went to 5V, GND to GND, SCK to D4 and SDA to D5.

IMG_20160223_212825.jpg

I downloaded the HX711 library written by bogde (thanks!) and also the HX711 breakout sketches from the SparkFun how-to linked above. I was pretty impressed to see numbers appear straight away on the serial monitor although this turned to mild disappointment when I placed a mass on the scales and the number went negative! Apparently I had got the polarity of the signal wires the wrong way around. 😦

Five minutes of soldering later I was back reading numbers and this time they went up with the mass on the scales. According to the instructions on the test sketch I kept adjusting the calibration factor until the scales read the correct mass for the object I’d put on it. Then came the acid test: now it was calibrated, would it get my mass right?

IMG_20160221_210139.jpg

As you can see it worked almost perfectly. And I am somewhat overweight. :-/

A useful edit I made to the SparkFun code was to change the line

Serial.print(scale.get_units(), 1);

To

Serial.print(scale.get_units(), 3);

This gave me three decimal places instead of one and significantly more information. I was particularly pleased to see that these scales read quite consistently. The numbers for my weight jump about quite a lot because I wasn’t too worried about keeping still to get a stable reading but when I placed a fixed mass on the scales the second decimal place was pretty stable and only the third flicked up and down by 1-3 units. These scales were advertised as being accurate to +/- 100g so my results indicate I can do much better than that. And that’s without any of the tricks you can use with microprocessors to improve the accuracy of otherwise low resolution tools, such as polling them and taking a moving average.

More on the application of this very cool hack another day, once I’ve validated the calibration as described on MakeZine.