Collecting and logging sensor data automatically is one of the most useful “sciencey” things you can do with programmable microprocessors like Arduino and Raspberry Pi. One problem with this is what to do with the data you are collecting. You can store it locally to the device, for example Arduinos can log temperatures or movement signals from PIR sensors to SD cards. However, you have to turn the device off and remove the card, put it into a laptop and copy the data off it before you can access it. Alternatively you can send the data over a serial connection or wirelessly to another device which will store the data for you for easier retrieval or even real-time plotting. Recently small GSM/GPRS modules have become available which are essentially the guts of a mobile phone with no screen, battery or keyboard. These enable you to use mobile phone networks to send data to the internet using protocols such as GPRS and 3G. This is very useful for science as field experimental sites rarely sport ethernet ports or wireless routers through which to transmit data from long-term monitoring sites.
The Adafruit Fona is one of these devices and I obtained one with the intent of monitoring the temperatures in some of our more critical freezers and fridges in case one of them broke down, imperilling the irreplaceable scientific samples stored within. I’ve already set up one device using a GPRS shield from Elecrow. You can see the feed from it here. Its logging temperatures from three freezers in a shed on AUT’s North Campus where various valuable samples are stored. The Fona is a little smaller and a little cheaper and I wanted to make another couple of devices to deploy in our labs to keep an eye on the freezers there. These contain not only valuable samples but, in our molecular labs, thousands of dollars worth of reagents for the MiSeq, our next generation sequencing platform. The idea here is not just to keep an eye on the functionality of the freezers but to get notified if the power goes down. Freezers are well insulated so if the power goes off the temperature won’t immediately rise. If the power goes off on Friday evening, however…
In setting up the Fona I ran into problems getting code to work. The Fona code examples for GPRS access were limited to simple website recovery and not sending HTTP PUT requests, which is what is required to log data to Xively. Frustratingly the code I’d adapted from my previous GPRS logger didn’t work and I could find no indication as to why. Even more frustratingly the Arduino Xively libraries didn’t work either, probably because they had been written for use with WiFi or ethernet and not GPRS. Instructions are sent to the GPRS shields from your microprocessor using a special set of text commands, called AT commands. These commands need to be sent to the shield over a serial connection. The HTTP PUT requests sent to Xively must conform to something called REST, which is explained in somewhat inadequate detail in Xively’s API docs. So, to summarise: I had to use my Arduino to send AT commands to the Fona over serial that would instruct it to send PUT requests conveying my data to Xively. Three different communication protocols. Simples! >_<
To cut a long story short I managed to use a Python library to send updates from my laptop to Xively by HTTP PUT requests. Using more Python I then managed to log the text of those HTTP requests and use that as a template that I could deconstruct and send to the Fona from my Arduino, inserting real-time data from sensor reads. The result is the code linked at the bottom of this post, which logs temperature, pressure and humidity data from an Adafruit BME280 sensor as well as the battery voltage of the Li-Ion cell connected to the Arduino and Fona. Credit to Limor Fried/Ladyada and Chip McLelland, whose example sketches I adapted to create this.
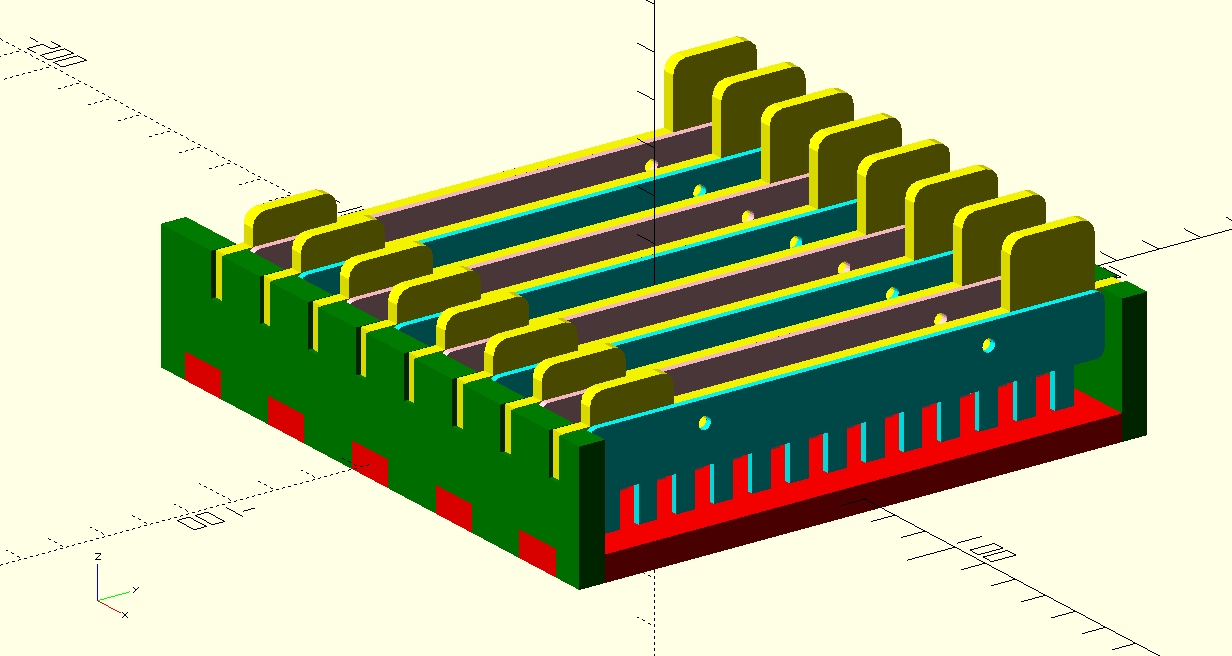
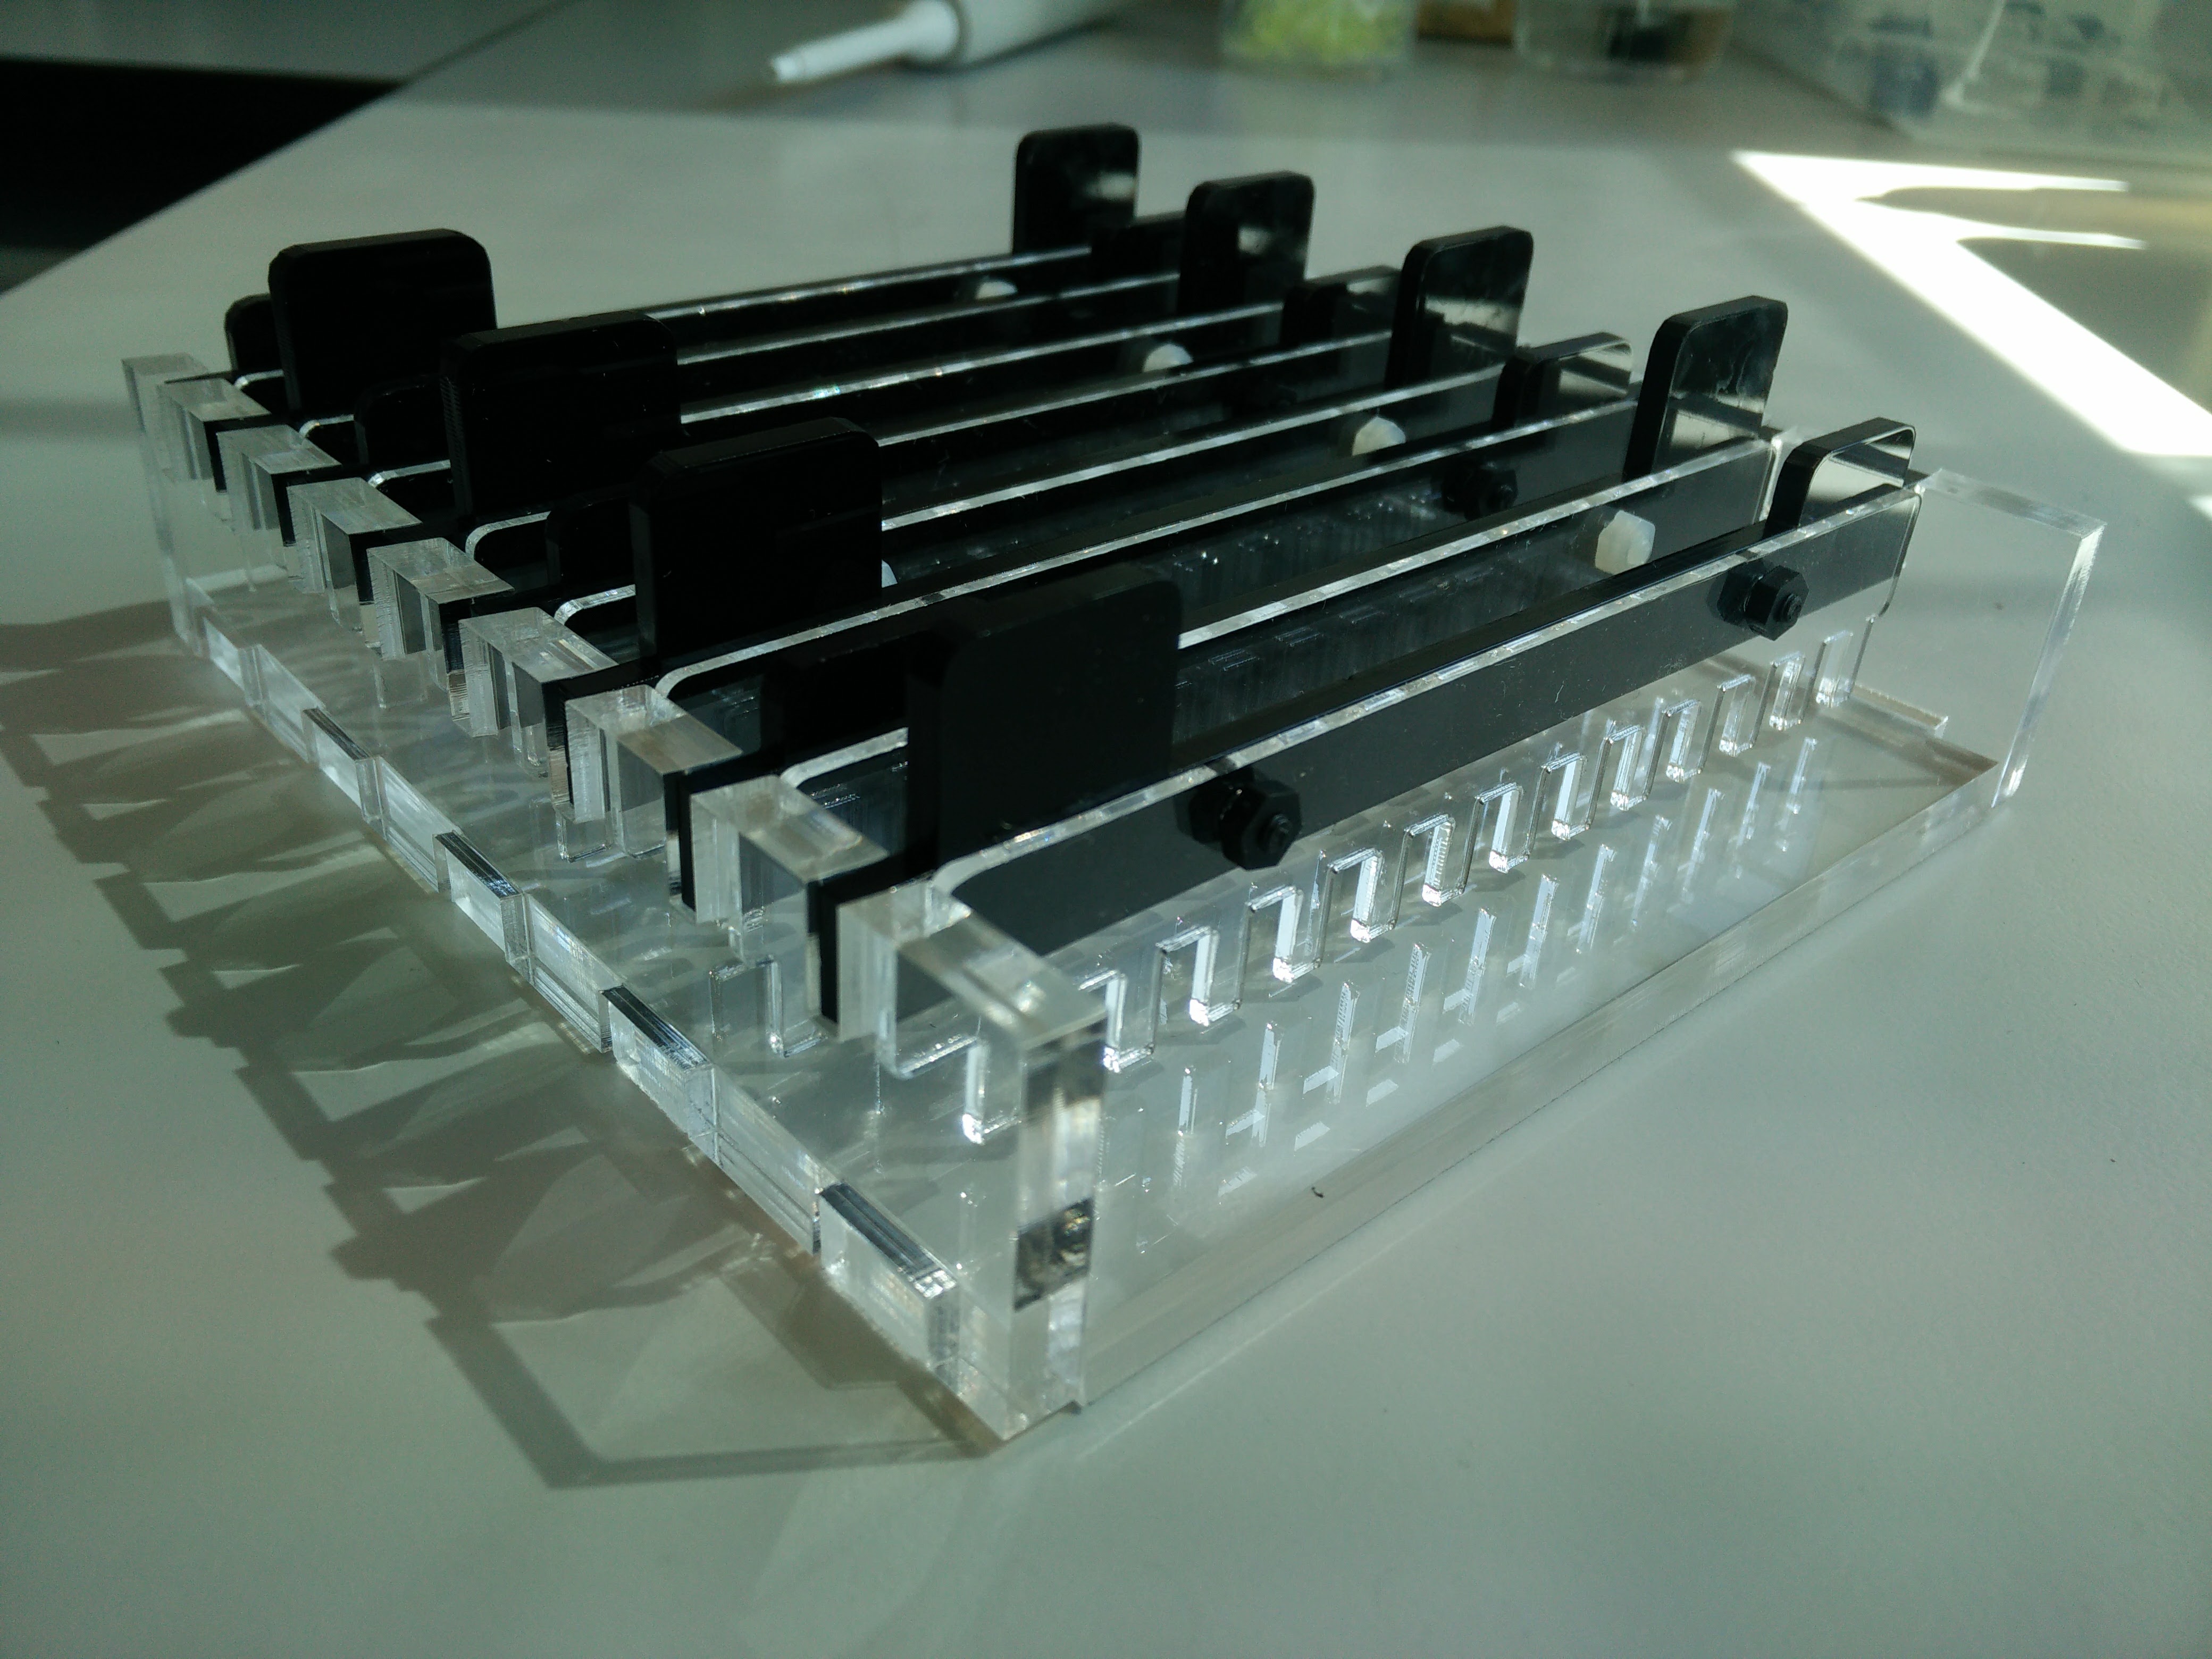
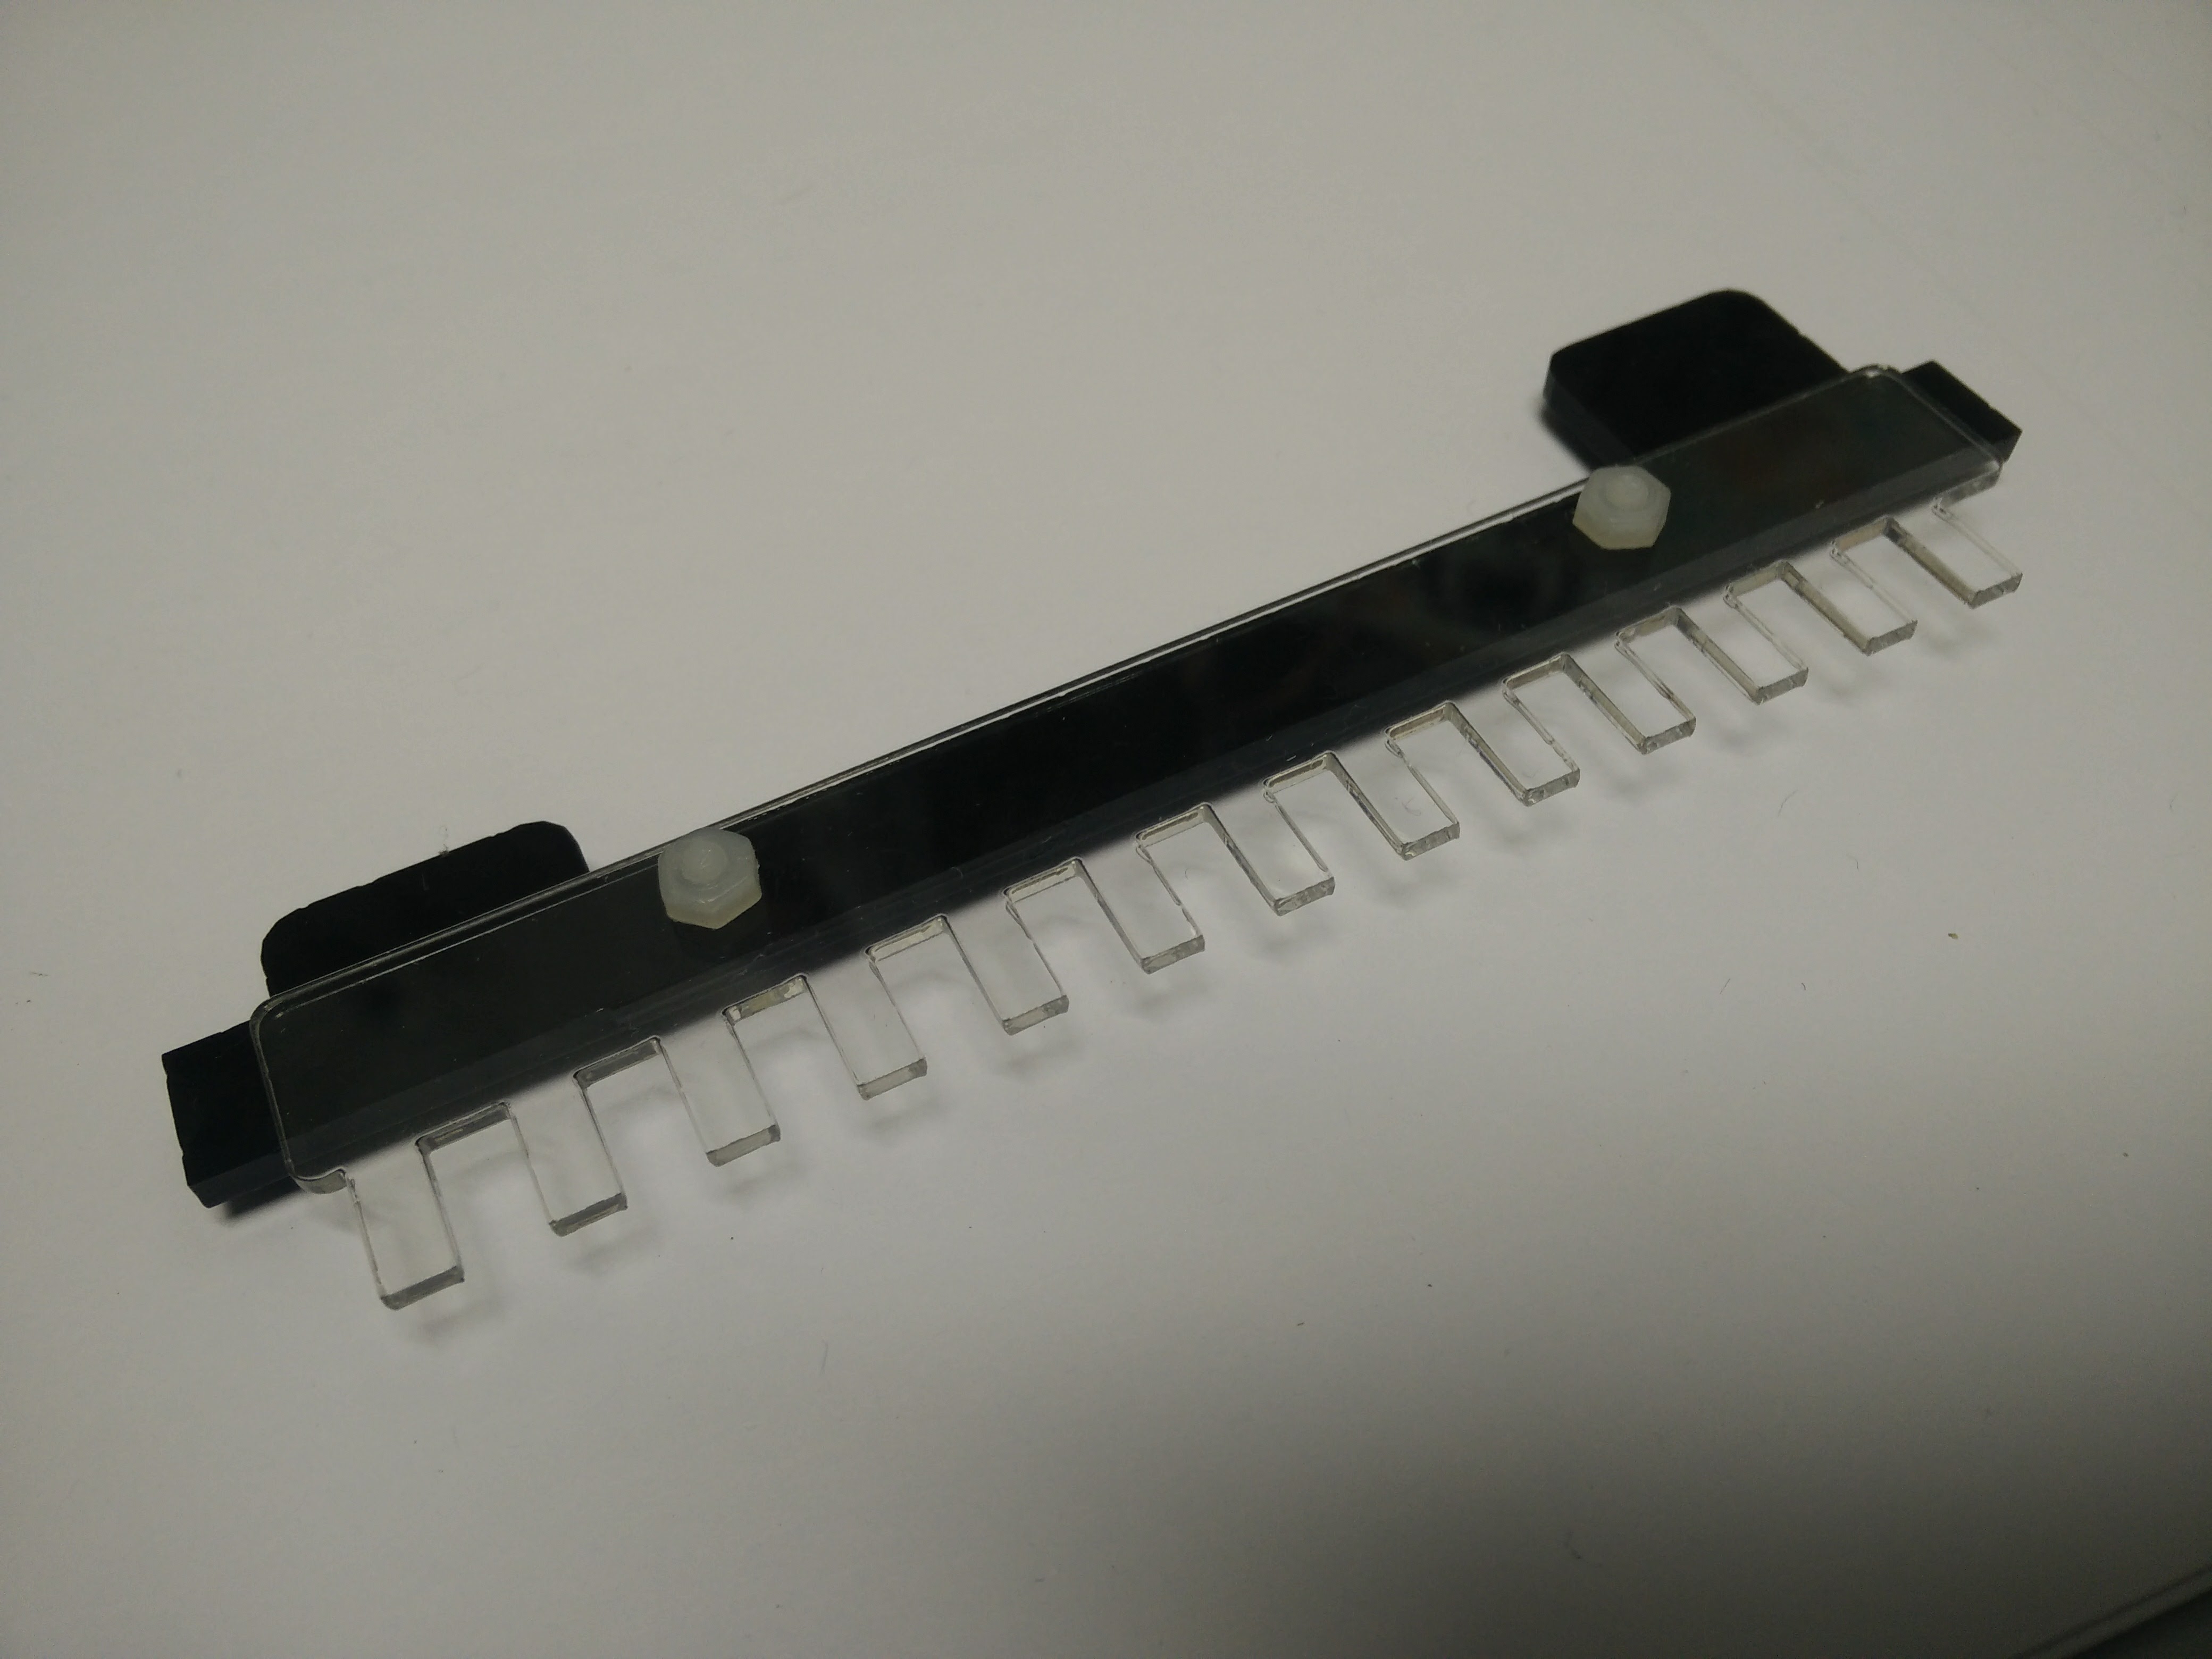
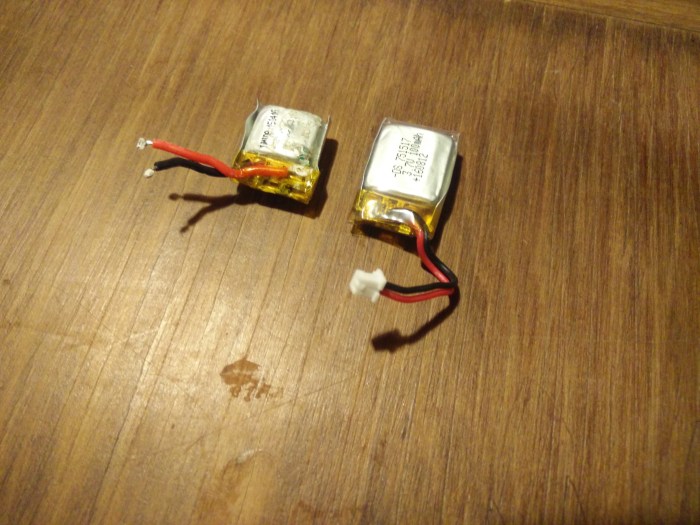
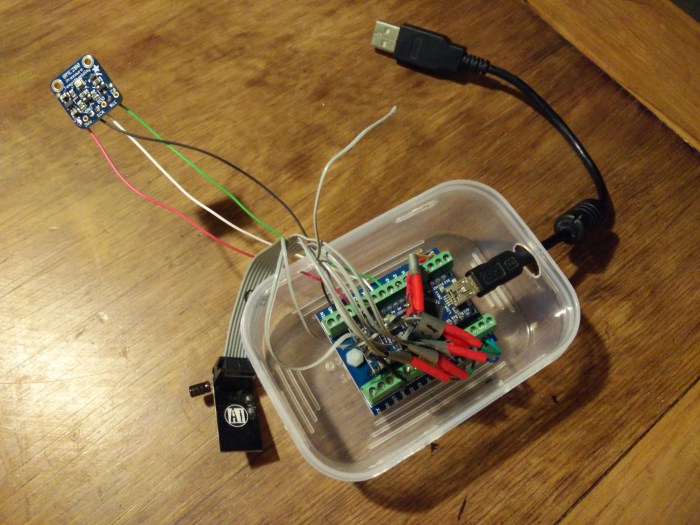
Here’s a quick pic of my setup. Its a Feather 32u4 LoRa, a uFL Fona and a BME280, all from Adafruit Industries. The Fona must have a lithium battery connected to it so I’ve added an 18650 Li-ion cell which is connected to both the Feather, which charges it, and the Fona. If the power does go out at work then the device will run for several hours on this battery, even without any low-power optimisation of the code. The enclosure is lasercut from 3mm acrylic. Its a beta version as I’ve yet to add mounts and an enclosure for the BME280. Ultimately I want this sketch to read three DS18B20 temperature sensors too, which will be in the freezers, but that’s a work in progress.

Download this code: Adafruit_Feather_Fona_BME280.ino